8. Damage and returns (rejection and recall costs)
At 1 million units/month, retort pouches typically save $37,000–$50,000/month vs cans.
That is $444,000–$600,000 per year — despite a higher unit price.
Table of Contents
1. The Unit Price Trap
2. The 8-Component TCO Framework
3. Component Deep Dive: Where Each Saving Comes From
4. TCO by Production Volume: Scale Impact
5. The Full Cost Waterfall
6. Investment & Payback Analysis
7. How to Calculate Your TCO
8. Your TCO Worksheet
9. FAQ
1. The Unit Price Trap
The most common mistake in packaging procurement is evaluating format options based on unit price alone. It is an understandable shortcut—unit price is visible on every invoice—but it consistently leads to higher total costs.
Here is the reality: a retort pouch may cost $0.17–$0.19 per unit versus $0.13–$0.15 for an equivalent metal can. At face value, the can appears 15–30% cheaper. But this comparison ignores six to seven additional cost categories that the can format systematically loses in.
Purchasing decisions made on unit price alone have a predictable outcome: the apparent saving on packaging materials gets consumed—and often exceeded—by higher logistics costs, slower throughput, greater energy consumption, and larger waste rates across the operation.
Important: The unit price trap is most dangerous at moderate volumes (100K–500K units/month) where the packaging savings appear meaningful but the logistics and processing penalties are large enough to reverse the economics. Always calculate full TCO before deciding.
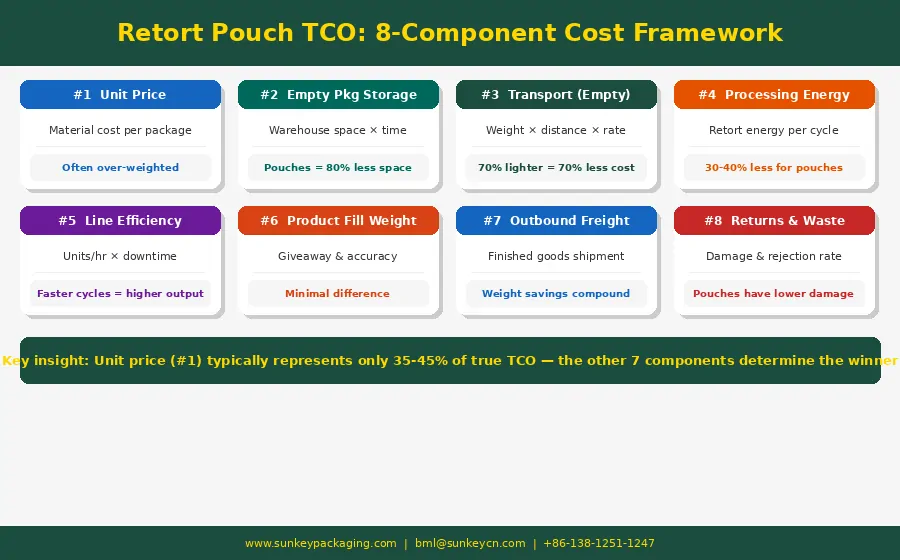
2. The 8-Component TCO Framework
A rigorous TCO analysis for retort packaging must account for all eight cost components that differ between format options:
#
TCO Component
Retort Pouch
Metal Can
Advantage
1
Unit price
$0.17–0.19
$0.13–0.15
CAN
2
Empty pkg storage
80% less space
Full pallet volume
POUCH
3
Empty pkg inbound freight
70% less weight
Full metal weight
POUCH
4
Processing energy
30–40% lower
Higher thermal mass
POUCH
5
Line efficiency/throughput
Faster cycle, higher output
Slower retort cycle
POUCH
6
Product fill accuracy
Comparable
Comparable
Neutral
7
Outbound freight (finished)
70% lighter per unit
Heavier per unit
POUCH
8
Damage & returns
Lower damage rate
Dents = defects
POUCH
Pro Tip: Track each of these 8 components separately in your cost model. Suppliers who quote only unit price are showing you one number that represents less than half the economic story.
3. Component Deep Dive: Where Each Saving Comes From
3.1 Component #1: Unit Price — The Visible Cost
Retort pouches carry a unit price premium of 15–30% over equivalent metal cans. This is real and should not be dismissed. The question is not whether this premium exists, but whether it is more than offset by savings across the other seven components. In most cases at volumes above 100K units/month, it is.
This is where the economics of retort packaging begin to reverse. Metal cans are rigid, pre-formed containers. They ship, store, and handle at full volume—empty. Retort pouches ship flat:
- A standard pallet holds approximately 2,000 metal cans — pre-formed, full volume
- The same pallet holds 12,000–15,000 flat-packed pouches
- Warehouse space requirement: cans need ~6× more space per unit stored
- Inbound freight: pouches weigh 70% less, directly reducing freight cost per unit
Logistics Metric
Retort Pouch
Metal Can
Savings (Pouch)
Weight per 1,000 units (empty)
~15kg
~50kg
-70%
Pallet capacity (units)
12,000–15,000
2,000–2,500
+500%
Warehouse space (m² per 100K units)
~8 m²
~40 m²
-80%
Inbound freight cost/1,000 units
Base reference
+$2.50–4.00 premium
Pouch wins
3.3 Component #4 & #5: Processing Energy & Line Efficiency
The retort process is where pouches deliver a compounding operational advantage. The thin, flat geometry of a retort pouch allows heat to penetrate to the product's coldest point significantly faster than through the walls of a cylindrical can:
- Retort cycle time for pouches: typically 15–30 minutes for most products
- Retort cycle time for equivalent cans: typically 45–90 minutes
- Faster cycles mean more batches per shift on the same retort vessel
- Energy consumed per 1,000 units: 30–40% lower for pouches
- For a 2-vessel operation running 3 shifts, this equates to 4–6 additional batches per day
Pro Tip: If your retort vessel is currently running below 85% capacity utilization, switching to pouches can meaningfully increase throughput without any capital investment. This hidden productivity gain is rarely captured in packaging cost comparisons.
3.4 Component #7: Outbound Freight — Where Weight Savings Compound
The 70% weight reduction per empty package continues to generate savings in outbound finished goods freight. A filled retort pouch weighs approximately 30–35g less than a filled metal can of equivalent content weight—because the package itself is lighter:
- For a 200g wet pet food product: pouch weighs ~215g filled vs ~250g in can
- Per pallet of 2,000 units: pouch pallet is 70kg lighter than can pallet
- For international container shipments (20,000 units): ~700kg less per container
- At typical air freight rates ($3–5/kg), even small volumes generate material savings
3.5 Component #8: Damage & Returns
Metal cans are vulnerable to denting during shipping and handling. A dented can is typically a rejected unit—the seal integrity cannot be confirmed and the product is unsaleable or requires reinspection. Retort pouches absorb impacts without seal compromise:
- Typical can damage rate in distribution: 0.5–1.5% of units
- For 1 million units/month, a 0.8% damage rate difference = 8,000 units/month
- At $1.50 product value per unit, this represents $12,000/month in prevented waste
4. TCO by Production Volume: Scale Impact
The economics of retort pouches improve with scale, but the format is viable at surprisingly modest volumes. At 100,000 units per month, the logistics savings alone typically cover the unit price premium. At higher volumes, the net TCO advantage compounds:
Volume
Annual Units
Unit Price Premium (vs can)
Total Annual Savings (TCO)
Net Annual Benefit
100K/month
1.2M
+$0.04/unit = -$48K
+$0.077/unit = +$92K
Net +$44K/year
500K/month
6M
+$0.04/unit = -$240K
+$0.077/unit = +$462K
Net +$222K/year
1M/month
12M
+$0.04/unit = -$480K
+$0.077/unit = +$924K
Net +$444K/year
5M/month
60M
+$0.04/unit = -$2.4M
+$0.077/unit = +$4.62M
Net +$2.22M/year
Important: These figures are illustrative benchmarks based on typical industry data. Actual TCO savings vary by product category, shipping distance, regional energy costs, and supply chain structure. Always calculate your specific TCO using your actual cost inputs.
5. The Full Cost Waterfall
The waterfall chart below shows how starting from a can baseline cost and applying each retort pouch component, the final TCO compares:
The key insight from the waterfall: the unit price premium (Component #1) is real but is the only cost where cans have an advantage. All seven remaining components favor pouches. The sum of the pouch advantages exceeds the unit price premium by a meaningful margin in most scenarios above 100K units/month.
6. Investment & Payback Analysis
Transitioning from cans to retort pouches requires upfront investment in filling equipment and process revalidation. Understanding the payback period is essential for building the business case:
Investment Category
Low Estimate
High Estimate
Notes
FFS filling line (new)
$600,000
$2,000,000
Full form-fill-seal line
Premade pouch filler (new)
$150,000
$600,000
Uses pre-made pouches, simpler
Process revalidation
$20,000
$80,000
Heat penetration + authority review
Staff training
$5,000
$20,000
Operator and QA training
Trial production runs
$15,000
$50,000
Line qualification and first articles
Total investment range
$190,000
$2,750,000
Depends on line type and volume
Pro Tip: Contract manufacturing is a low-investment path to market validation. Several contract manufacturers operate retort pouch filling lines. Running 3–6 months of production through a co-manufacturer before capital investment allows you to confirm market demand, validate your process, and build the business case with real data.
For producers unwilling or unable to commit to capital investment, a co-manufacturing arrangement preserves the TCO advantage on logistics and processing while deferring equipment expenditure. The co-manufacturer's filling fee typically runs $0.02–$0.06 per unit, partially offsetting the logistics savings—but the overall TCO picture often remains favorable.
7. How to Calculate Your TCO
Use this step-by-step process to build your own TCO model:
Step
Action
Data Source
Typical Complexity
1
Gather current can costs: unit price, storage, freight rates
Your procurement team
Low
2
Get retort pouch quotes from 2–3 qualified suppliers
Pro Tip: Steps 4–6 account for 60–70% of the total TCO differential. Spend the most time gathering accurate data for logistics rates, retort cycle times, and energy costs. Errors in these inputs will distort the output significantly.
8. Your TCO Worksheet
Use the worksheet below to collect the inputs for your TCO calculation. Fill in your current format (can) values and the retort pouch quotes you receive, then compare the totals:
Once you have completed the worksheet, you can calculate the per-unit TCO differential and apply it to your annual volume to determine the annual savings opportunity. Alternatively, send the completed worksheet to bml@sunkeycn.com and our team will build the full TCO model for you.
9. Frequently Asked Questions
Q1: What is a realistic TCO saving per unit when switching from cans to retort pouches?
Based on industry benchmarks, total TCO savings typically range from $0.03 to $0.07 per unit at volumes of 100K–1M units per month. The main variable is logistics cost structure: operations with long inbound and outbound shipping distances see the highest savings, while local short-haul operations see less impact. Get a custom TCO model for your specific situation by contacting our team.
Q2: My unit price quotes for retort pouches are 25% higher than my current can price. Should I still consider it?
Yes, absolutely. A 25% unit price premium is within the typical range and is offset by logistics, processing, and storage savings in most scenarios above 200K units/month. The waterfall analysis in Section 5 shows how a 17% unit price premium (from $0.14 to $0.165) is more than offset by savings across the other seven TCO components. Request our TCO template to model your specific situation.
Q3: How accurate are the TCO figures in this guide?
The figures are illustrative benchmarks built from industry data. Your actual TCO will differ based on your specific logistics rates, regional energy costs, distance to markets, and supply chain structure. We strongly recommend building a custom model with your actual inputs rather than relying on industry averages. Our team provides free custom TCO analysis for qualified projects.
Q4: Does TCO change if we use a co-manufacturer instead of our own filling line?
Yes. Co-manufacturer filling fees ($0.02–$0.06 per unit) add a cost that partly offsets the logistics savings. However, the model often still favors pouches for the following reason: the logistics savings (freight + storage) are structural and occur regardless of who fills the pouch. The co-manufacturing fee is a conversion cost that can be reduced or eliminated once you bring filling in-house.
Q5: How long does a TCO analysis typically take?
A basic TCO comparison using the worksheet in Section 8 takes 1–2 hours with inputs from your procurement, logistics, and production teams. A detailed bottom-up model with sensitivity analysis takes 2–3 days. Our team can turn around a custom TCO analysis within 3–5 business days when you provide the required inputs.
Q6: What is the typical payback period for a retort pouch filling line investment?
Payback period varies significantly by volume and investment level. At 500K units/month with a $350,000 investment in a premade pouch filler, payback is typically 12–18 months. At 1M+ units/month with a full FFS line, payback ranges from 18–30 months depending on line cost and TCO savings. Co-manufacturing eliminates the payback period question entirely — costs are variable from day one.
Q7: Are there situations where the TCO genuinely favors metal cans?
Yes. Three scenarios favor cans on TCO: (1) Operations where empty packaging ships very short distances, eliminating the freight advantage. (2) Very low volumes (under 50K units/month) where the logistics savings are too small to offset the unit price premium. (3) Products requiring 36+ month shelf life, where cans' superior barrier performance avoids the cost of product loss from premature spoilage.
Q8: How do I present the TCO case internally to justify the switch?
The most effective internal presentation structure: (1) state current annual packaging cost, (2) show unit price comparison (unfavorable), (3) reveal the full 8-component TCO (favorable), (4) quantify annual savings at your volume, (5) show payback period for any investment required, (6) present risk mitigation plan. Sunkey can provide supporting data and a co-branded TCO presentation for internal use on request.
Get Your Free Custom TCO Analysis
Send us your current packaging specs and monthly volume. Our team will build a complete TCO model for your specific situation — at no cost.
Select your packaging needs by filtering through our comprehensive categories. If you don't find what you're looking for, feel free to contact us for custom solutions.